
Creating Value in the Pool of Data
Note: a summary version of this article was originally published for APAC CIO Outlook Magazine (Sept 2017).

Note: a summary version of this article was originally published for APAC CIO Outlook Magazine (Sept 2017).
What were they thinking?

Waterloo, Sunday, June 18th 1815. Napoleon was faced with a decision to wade his army through mud and tire them during the early stage of the battle, or wait another day for the ground to dry out. Waiting one more day meant risking Prussian reinforcement for the British Army. At the beginning of the Battle, Napoleon had 72,000 soldiers under his command, while the British Army under Wellington accounted for 68,000 soldiers. But the tides were turned after the Prussian Army of 50,000 soldiers came to the rescue.
In hindsight, his decision to wait was what cost him the battle, and the War eventually. After Waterloo, Napoleon never managed to regroup, as the defeat signaled the end of his era. (Source). What is he thinking?

On August 28, 1963, Martin Luther King, Jr. approached the podium near the Lincoln Memorial with something he didn’t normally need: notes. Sensing the importance of the moment, King had stayed up late the night before perfecting his speech. But as he delivered it, he came to a line that wasn’t quite right. Off to the side, the singer Mahalia Jackson shouted, “Tell them about the dream, Martin!” King paused, looked out over the crowd, and went off-script, saying, “I say to you today, my friends, even though we face the difficulties of today and tomorrow, I still have a dream.” The rest of the speech stayed on that theme and “I have a dream” went down in history as one of the most memorable phrases ever delivered. Four words that shaped America (source). What is he thinking?
On January10th 2000, AOL and Time Warner announce they will merge with Time Warner for US$164 billion, creating a total new entity valued at USD $350B. The value of the America Online division dropped significantly, not unlike the market valuation of similar independent internet companies that drastically fell, and forced a goodwill write-off, causing AOL Time Warner to report a loss of $99 billion in 2002 — at the time, the largest loss ever reported by a company. The total value of AOL stock subsequently went from $226 billion to about $20 billion (source). What were they thinking?
Everyday we make decisions that impact our businesses, our teams and ourselves. Our boldest, brightest and poorest decisions are based on logic and guts.
Can we design a consistent process to better predict business outcomes?
Three main challenges have been identified:
Raw data is useless
We are not rational
We are selfish: my success is not ours
So, how to turn your data into a competitive advantage? or even better: how to turn your decisions into a competitive advantage?
#1 Raw Data Is Useless. Set Clear Goals
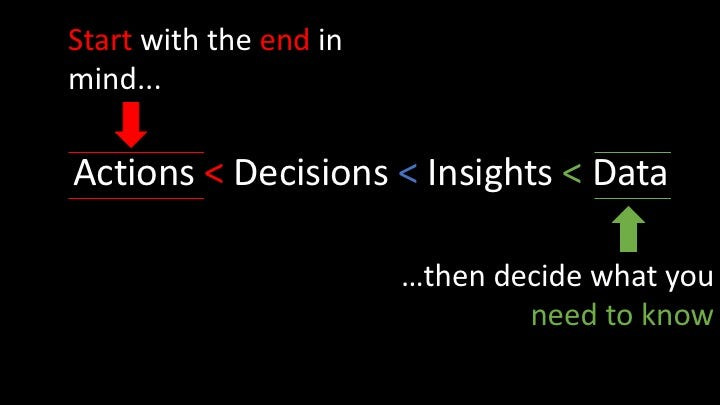
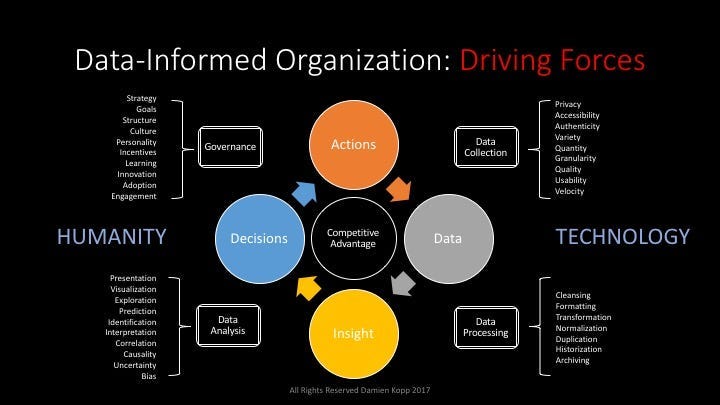
Raw data is like crude oil: it’s sticky, stinky, heavy and useless! What you chose to do with your data is far more important that the data itself. Businesses can spent a lot of effort collecting data and mining them for insights. There is no shortcut from Data to Actions: setting clear goals is the first step. Doing the right things require making sound decisions based on logic and guts and informed by insights. Your Data Strategy has to be informed and driven by your company’s strategic goals: the data you need to answer your key business questions.
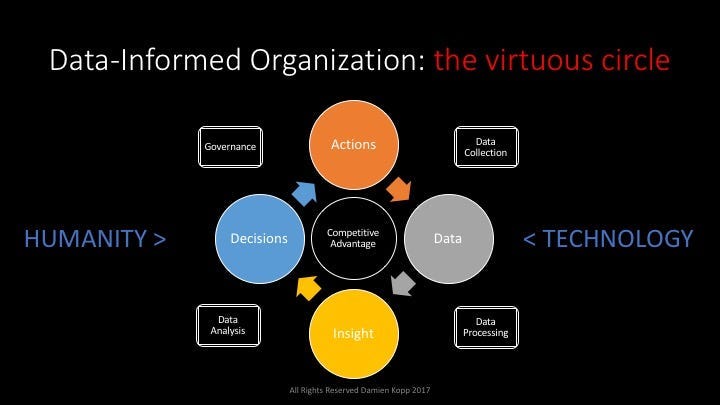
A data-informed organization is an organization that has built a decision process at all levels into a self-learning, fact-based virtuous circle. It’s an organization in which you can say: Thank you, “your opinion, however interesting, is irrelevant”. We want facts, facts, facts! (Source: Pragmatic Marketing).
As noted by Alistair Croll and Benjamin Yosk in Lean Analytics: Data-driven is different from Data-informed: data is only one element of the decision process.
Value driven Analytics focus on the opportunities for new revenues, new businesses and efficiencies. From one spectrum of the value chain to the other, there is a need to bring together technology and our humanity: data visualisations can help bridge this gap.
Think of the complexity of a symphonic orchestra and the data it generates: the musicians, the instruments, the notes, their velocity and intensity, etc. Mozart’s Clarinet Concerto, Second Movement, Adagio is represented here in a simple, intelligible form. See the full video below.
Visualizations can be very powerful ways to make sense of complex data sets as well as answering the question: ”does this look right?”
The visualisation below shows the real-time engagement distribution of the themes discussed on Twitter during the State of Union in 2014:
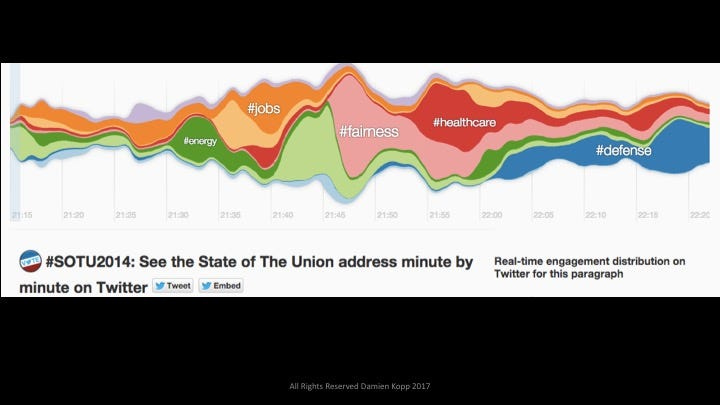
Another interesting one is the Google Music Timeline. A few more examples here: Visualisations that will blow your mind.
A good decision is a good answer to a good question
#2 We Are Not Rational. Ask Good Questions
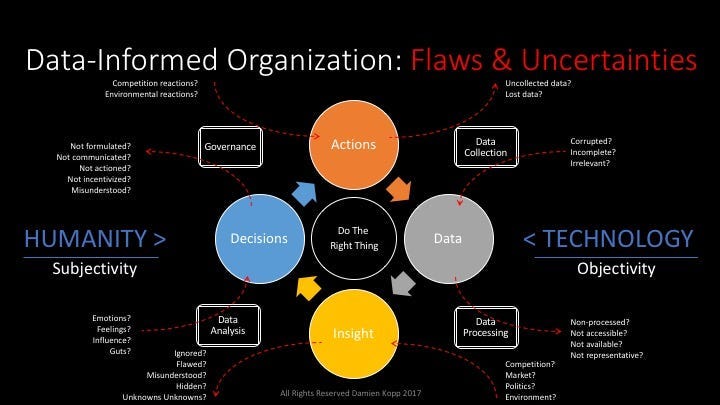
Understanding our flaws and biases is critical to sound decision making:
Correlation and causality are two different things: correlations may look right but be wrong. True correlations are interesting but the value is in true causality. See some great examples of spurious correlations here.
The flaw of averages: take the examples of the scientist who drowns in a river that is on average 3 feet deep (0.5 feet deep on the sides but 8 feet deep in the middle). In our world people want ONE number (“give me one number!”) but the reality is the distribution matters! More on the flaw of averages HBR here.
Apparent chaos may get us to overlook key information and insights.
Know where to look: it’s easy to get lost in the data
Remember that you never have the full picture: there is always a missing piece of information. Plus, you don’t know what you don’t know!
True But Useless: sometimes what you see is just not that interesting!
Even super-heroes can be wrong! The 21st century super-heroes (eg. data scientists and analysts) must have the ability to express complex data sets in simple terms, put them into a business context and have the relationship skills to interact well with decision makers.

“Common sense is very uncommon.” — Mark Twain
Demand the data and listen to your guts. Keep asking good questions!
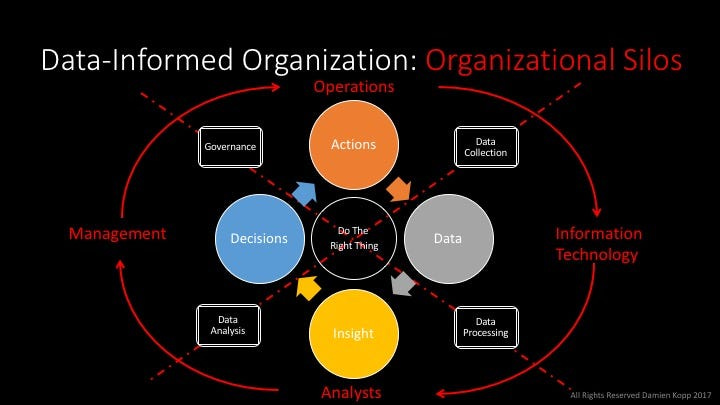
#3 We Are Selfish: My Success Is Not Yours. Measure The Right Thing
We are selfish: to tend to focus on our own success and respond to financial incentives in a predictable manner. Consider the departments or business units involved in managing the analytics value chain: each entity may have its own incentives, governance, culture, etc. Data is managed by IT but insights by analysts in different divisions who then report to various decision makers (there is no such thing as a Chief Decision Officer!) who then need to communicate to the Operations teams who doing the actual work.
Defining and measuring success at the enterprise level in a simple manner helps to align the organization towards a common goal. Measuring the right thing will help drive the right behaviours and create the right incentives in a coherent manner and in line with the company’s goals.
Choosing the right metrics:
Lagging vs. leading metrics: lagging metrics help monitor the current performance of the business but leading metrics can help track what ‘s going on at the peripheries. Consider how auto-makers track their performance today: car sales. Consider what this number means in the context of the sharing economy: Grab or Uber measure car utilization! So what will success mean to auto-makers in a few years?
Efficiency vs. value metrics: focusing on efficiency can make you overlook the value actually created to your customers. Consider a call center focused on time-to-resolution as their single metric for success instead of customer satisfaction or repeat sales.
Vanity vs. learning metrics: vanity metrics will make you feel good but they don’t really help you drive your business. Consider the launch of a new e-commerce company: if the founders focus only on unique visitors and clicks; they may look good. But if they focus on click-to-sale conversion rate they may learn that people abandon their cart half way through checkout: knowing why they drop out is far more important than the number of clicks! “Success is not a delivering feature; success is learning how to solve a customer’s problem.” — Mark Cook, Kodak.(See more on this @ Lean Startup).
The One Metric That Matters (OMTM): especially important for start-ups and new initiatives in particular. The OMTM helps you match the management to the maturity of the opportunity and to focus on the one thing that really matters at a point of time. Consider the launch of a new product or service: measuring Empathy — interest — first is far more important than measuring revenue. In fact, in Lean Analytics, Alistair Croll & Benjamin Yoskovit recommend to track successively Empathy, Stickiness, Virality, Revenue and Scale (see more on this @ Lean Analytics: Use Data to Build a Better Startup Faster)
More on this with this excellent article on metrics: Don’t Be Tyrannized by Old Metrics by Robert C. Wolcott.
Mismeasurement leads to mismanagement.
Ingredients of a successful value-driven analytics strategy:
1. Set Clear Goals: start with the End in mind
2. Ask Good Questions: know your Biases
3. Measure the Right Thing: define Success
Take Home Summary Slide:
Subscribe to my Newsletter
koncentrik.co
D. P. Kopp
Additional References: